Figure 5. Principal component analysis demonstrates relationship between patterns of aging- and diabetes-induced retinal gene expression.
To visualize the relationship of gene expression profiles across age groups, a principal component analysis was performed
using genes determined to be significantly regulated with aging. A clear progression in expression profiles was evident with
increasing age, and created a continuum ranging from the Young to Adult to Aged group. Previously reported expression data
for 3-month diabetic and nondiabetic control rats, aged 4 months, were included in this analysis. Diabetic rats were separated
from controls in a similar manner to the Aged group, demonstrating commonalities in expression changes and lending support
to the hypothesis of diabetes as a form of accelerated aging.
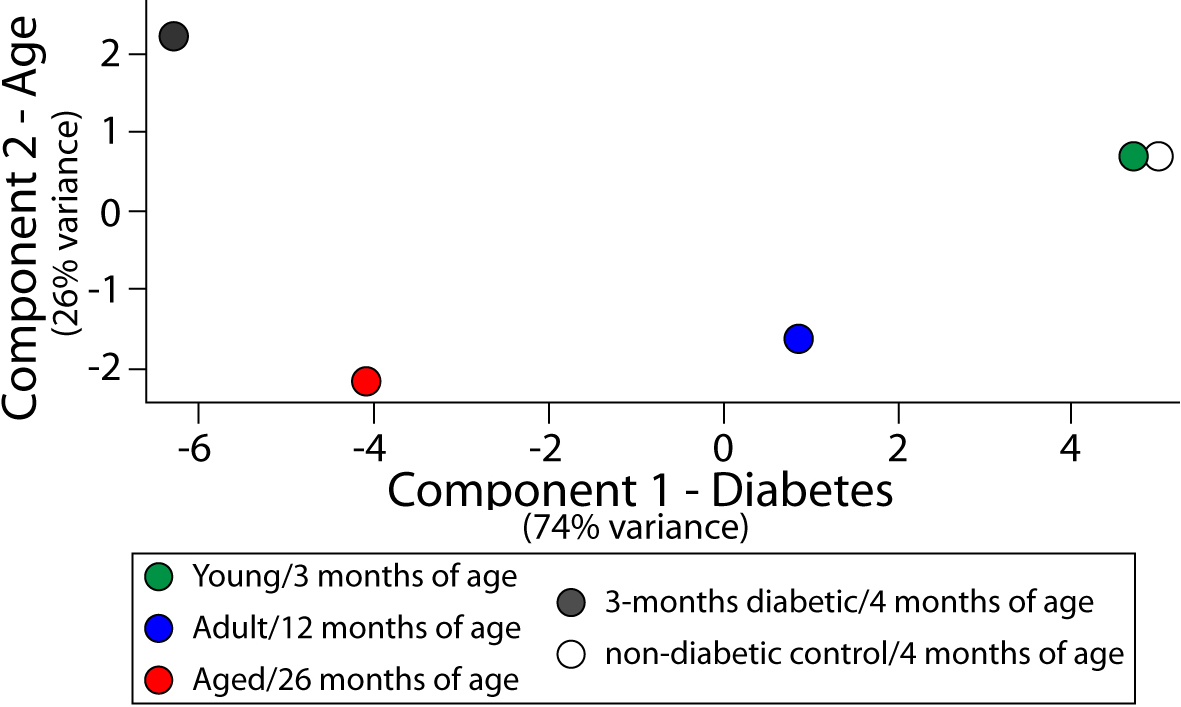
 Figure 5 of
Van Kirk, Mol Vis 2011; 17:1261-1274.
Figure 5 of
Van Kirk, Mol Vis 2011; 17:1261-1274.